Peptide profiler
Quick adme quote
Connect with us

Using state-of-the-art Visiopharm® software and custom AI-powered algorithms, we extract and interpret complex spatial and molecular data at scale. Explore how our image analysis capabilities can provide robust insight to guide your next steps and propel your drug discovery and development forward.
Robust image analysis is essential to generate insight and identify the most effective next steps for biomarker validation, immuno-oncology profiling, and drug response assessment. Whether slides are generated in-house or externally, our digital analysis process supports confident, data-driven decisions across discovery and development.
We can help you:
Each project is supported by an experienced team, who use their expertise to recommend assay design, algorithm selection, and data interpretation; ensuring efficient and robust dataset generation that aligns with the scientific objectives of the study. We have extensive experience working with a wide range of tissues and samples including mouse, rat and human, from very basic chromogenic stains to complex fluorescent multiplexing.
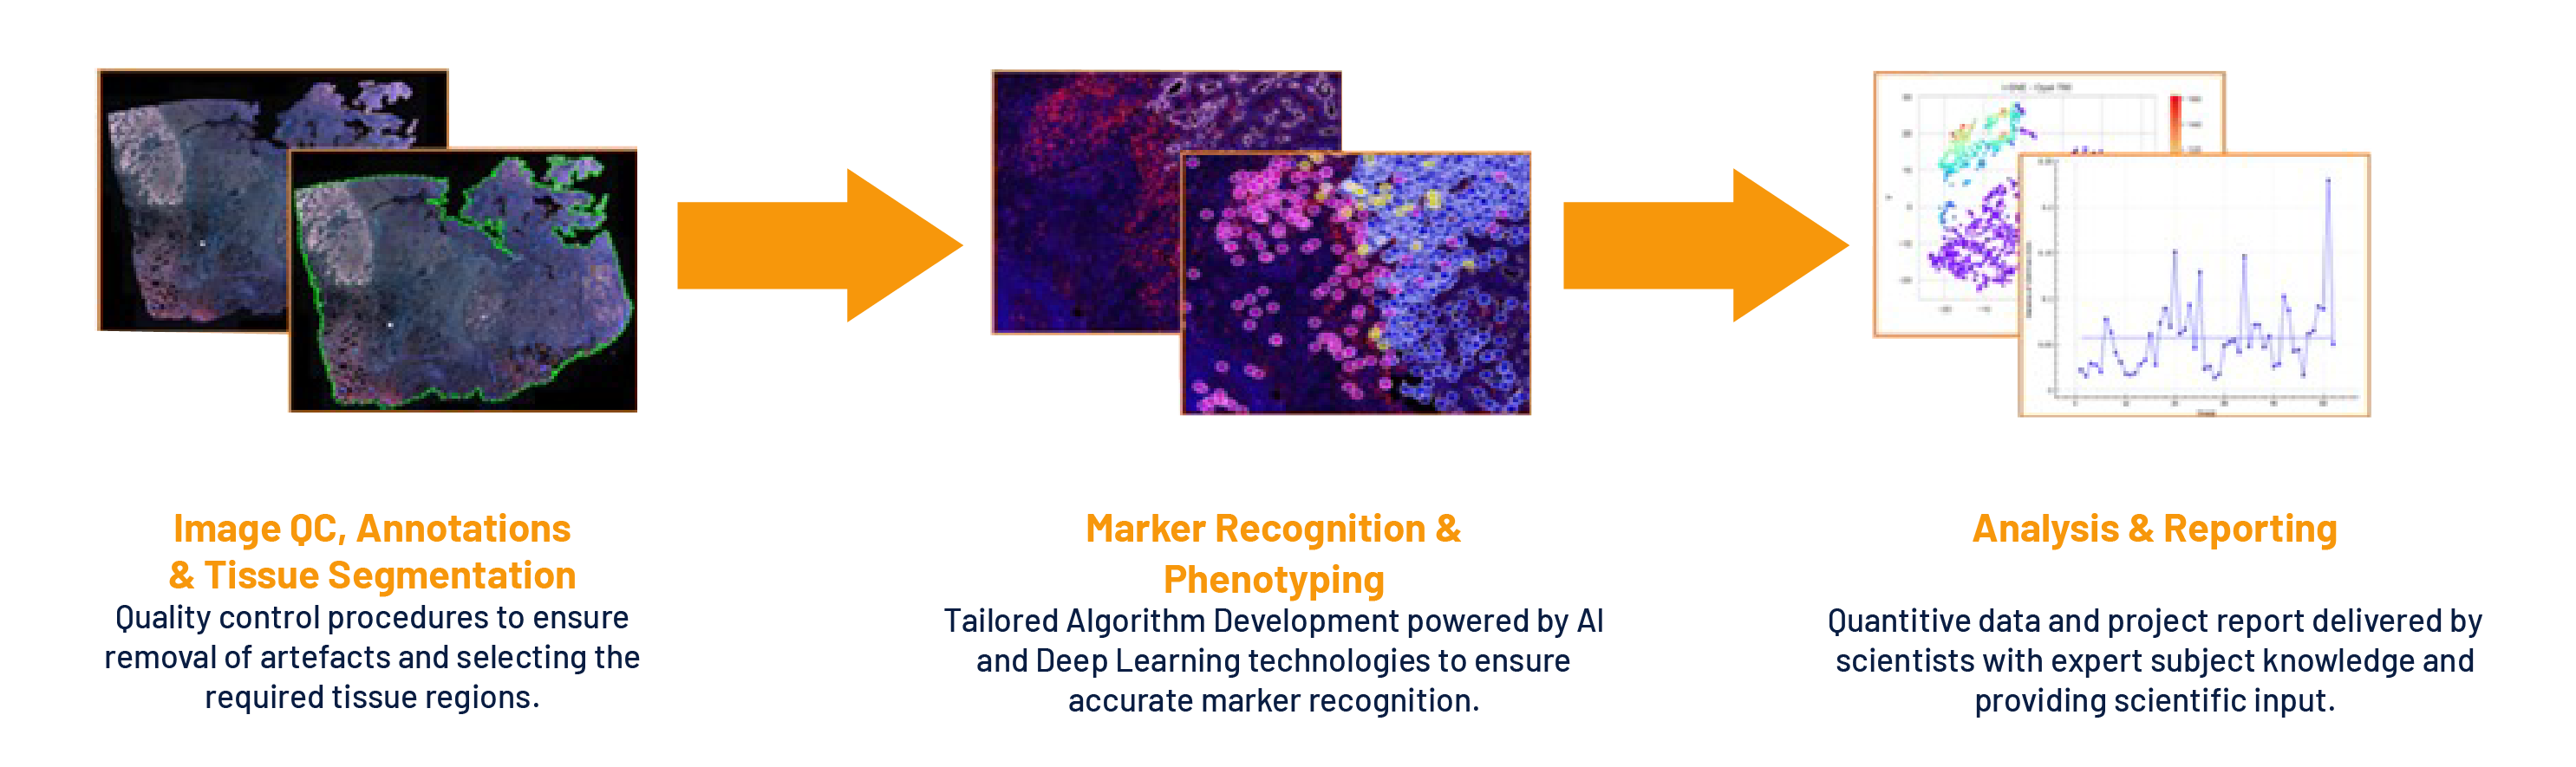
Image analysis workflows are custom-built to meet the demands of the study, and support a range of preclinical and clinical applications:
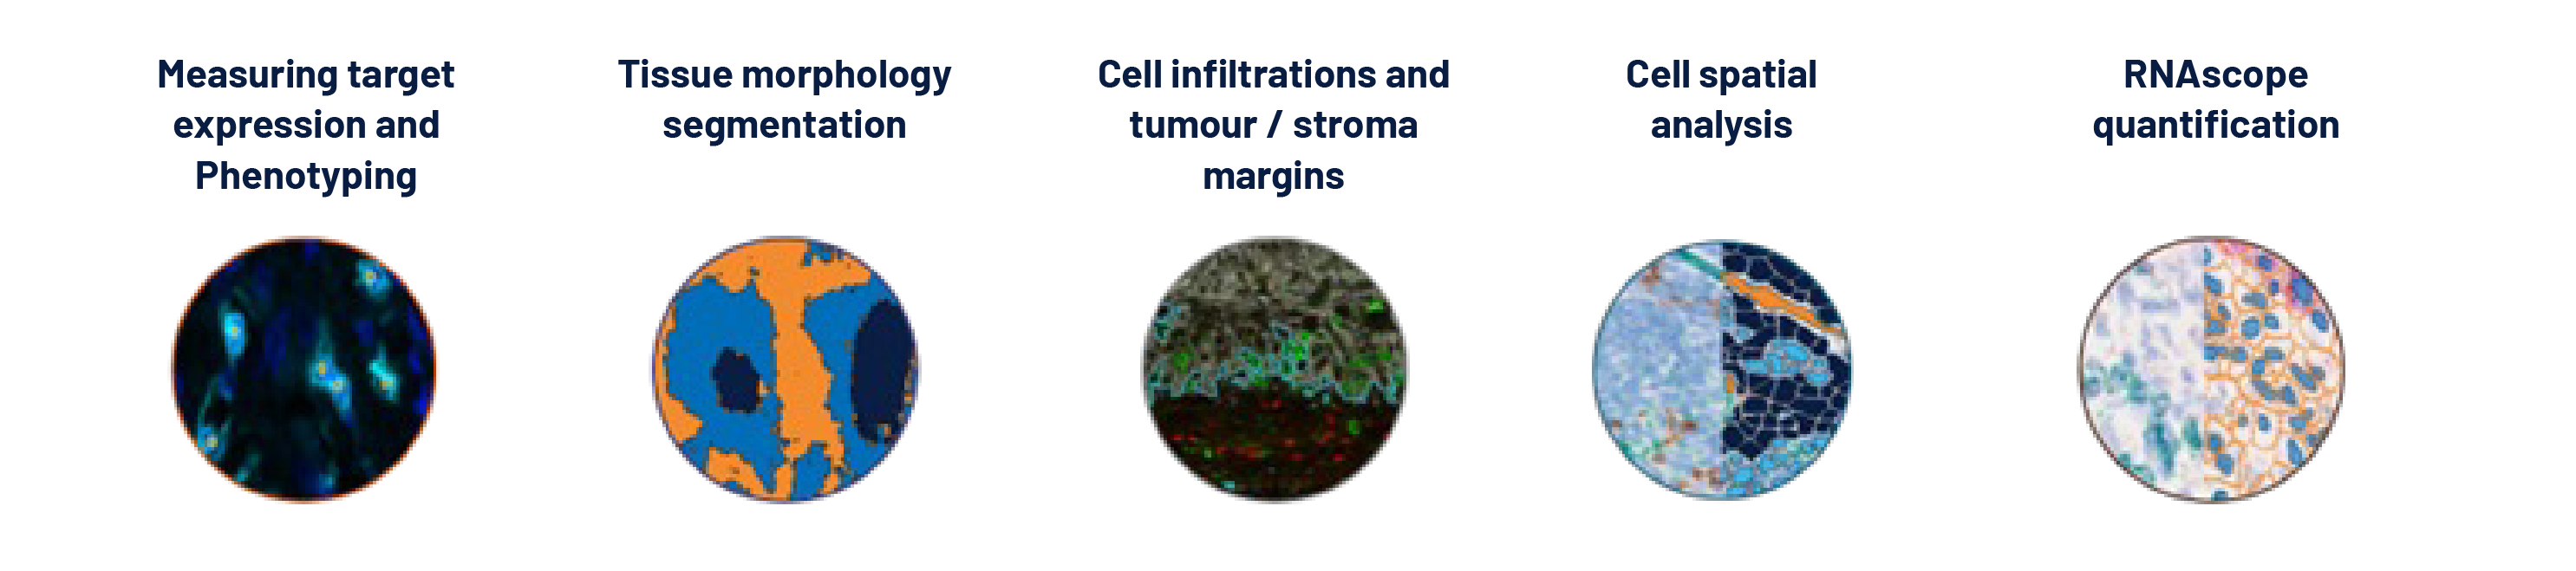
We provide quantification of biomarker expression at the cellular level across a wide range of tissue types, including TMAs. Applications include:
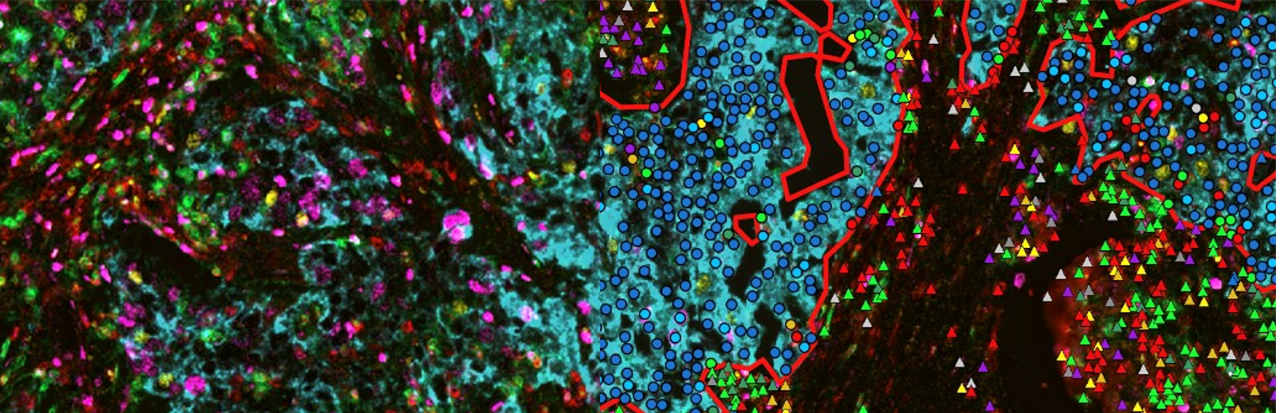
A suite of automated tools supports in-depth profiling of the tumour microenvironment:
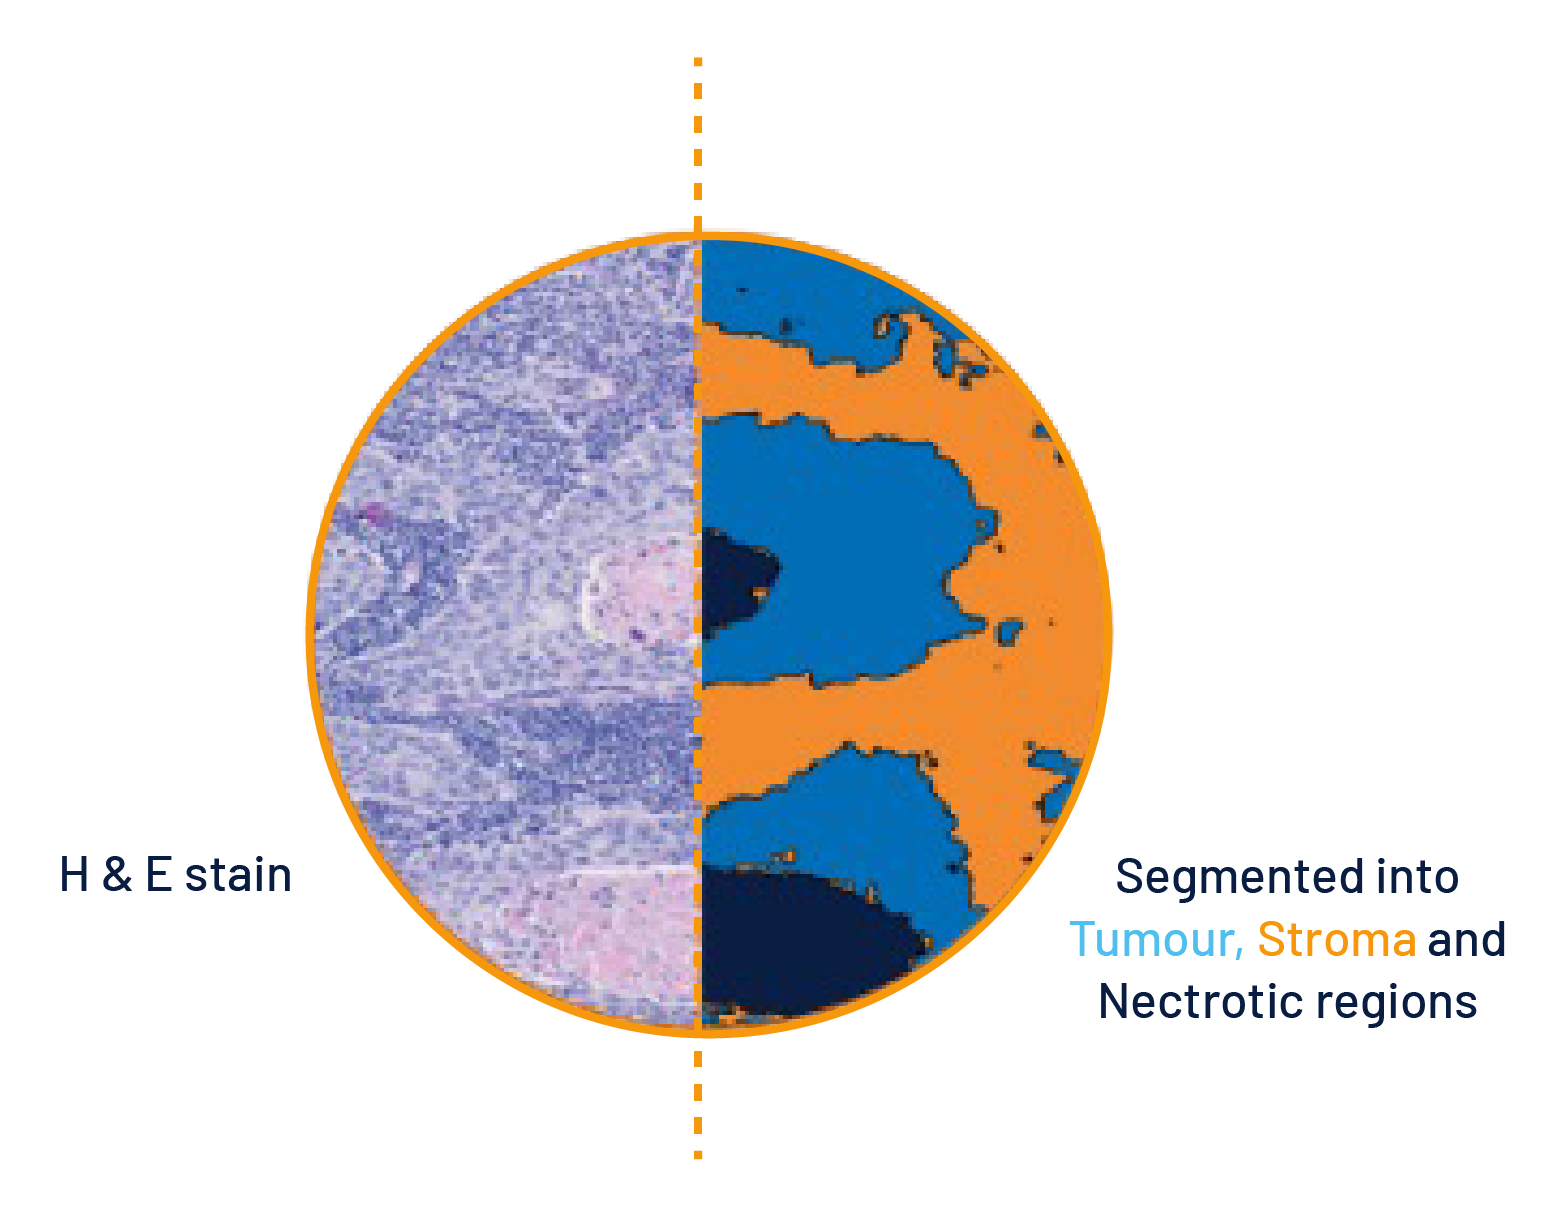
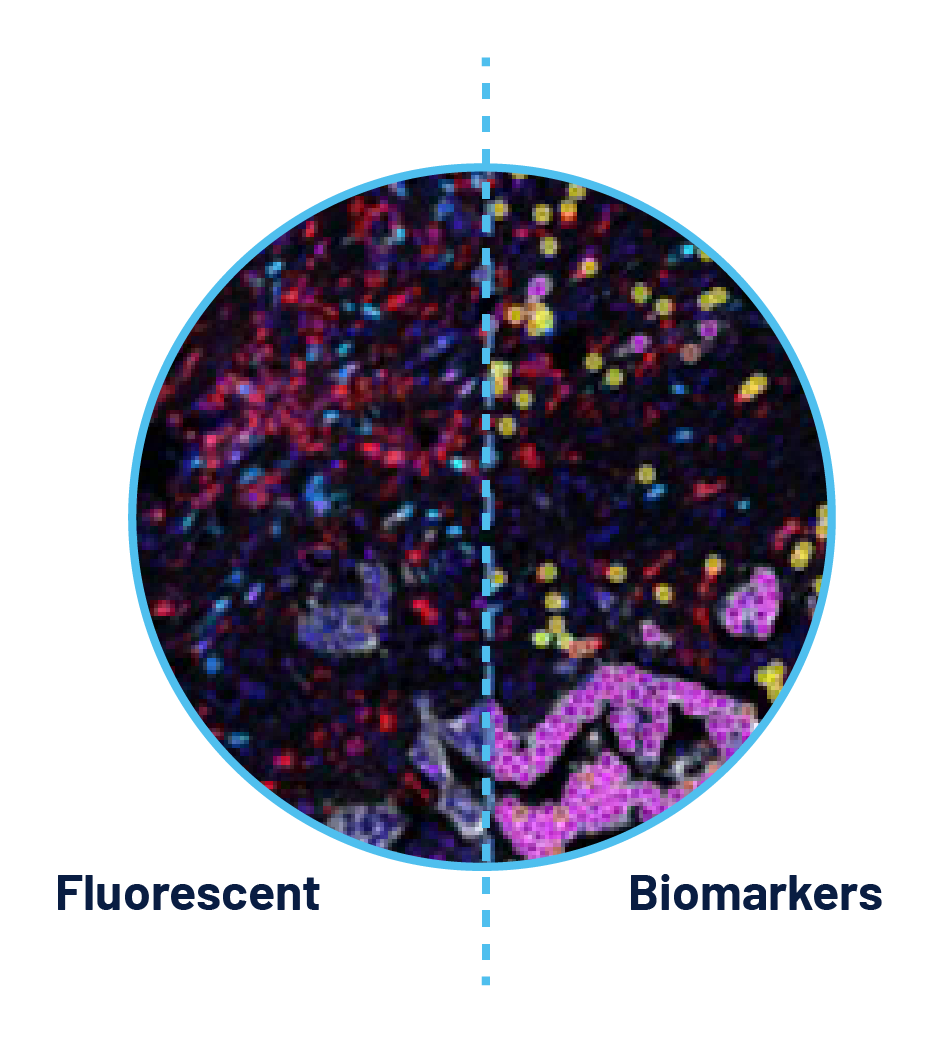
Differentiation of tumour, normal and tumour associated stromal, and necrotic areas using H&E or fluorescent markers.
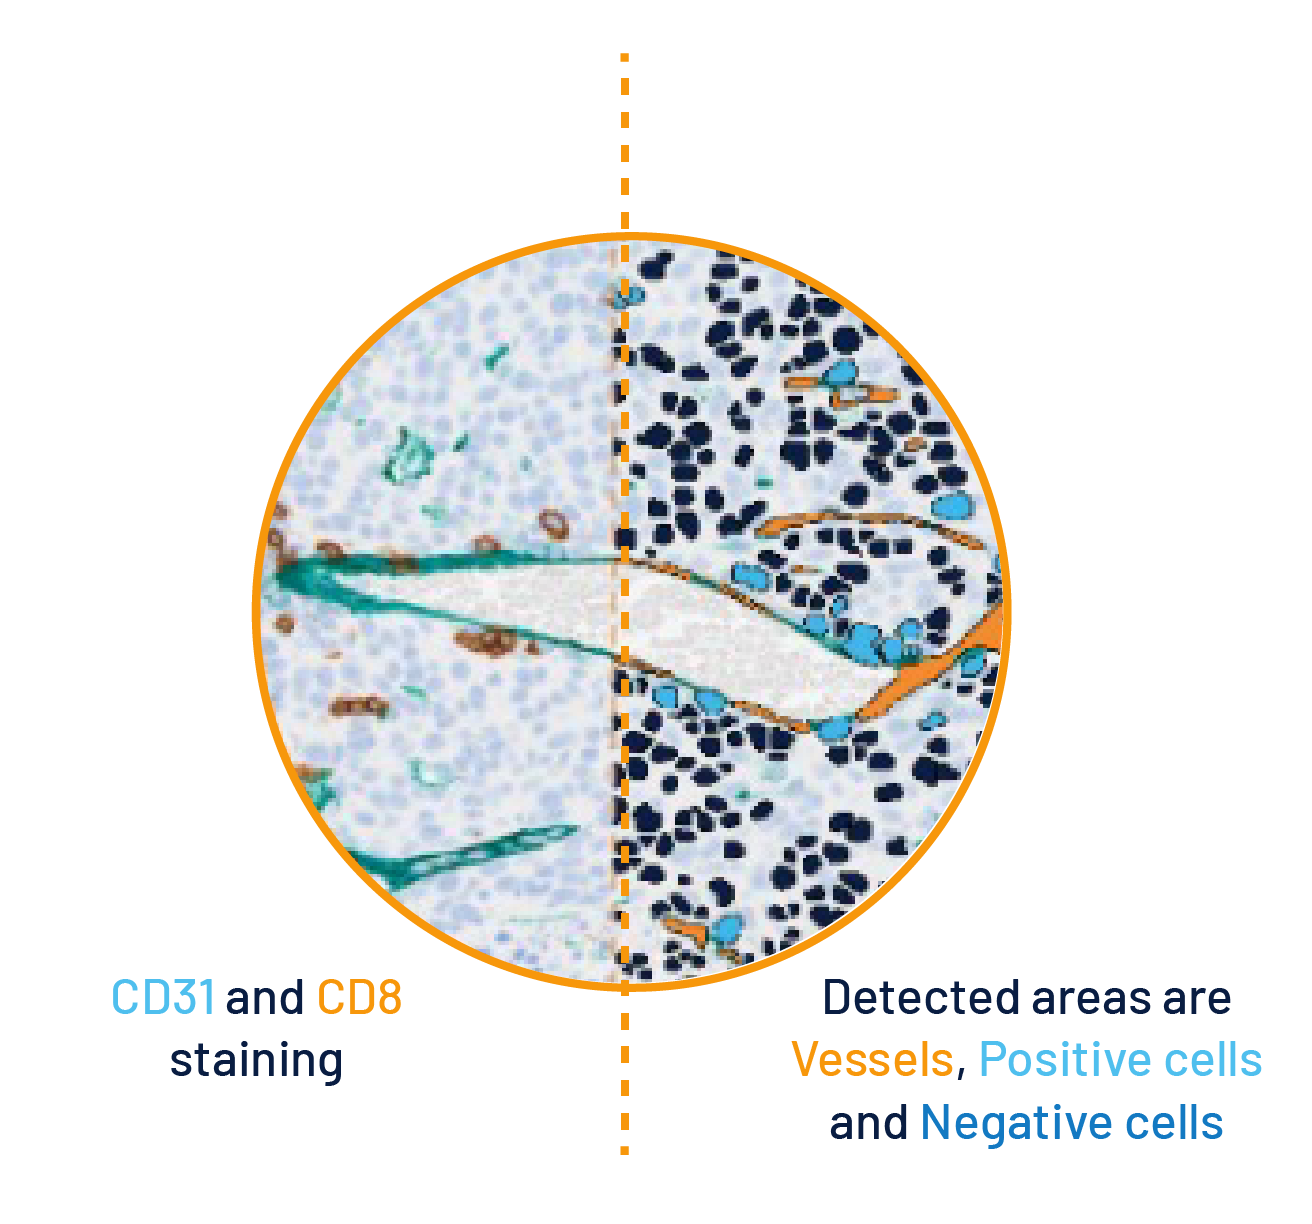
Classification and quantification of cells based on biomarker expression:
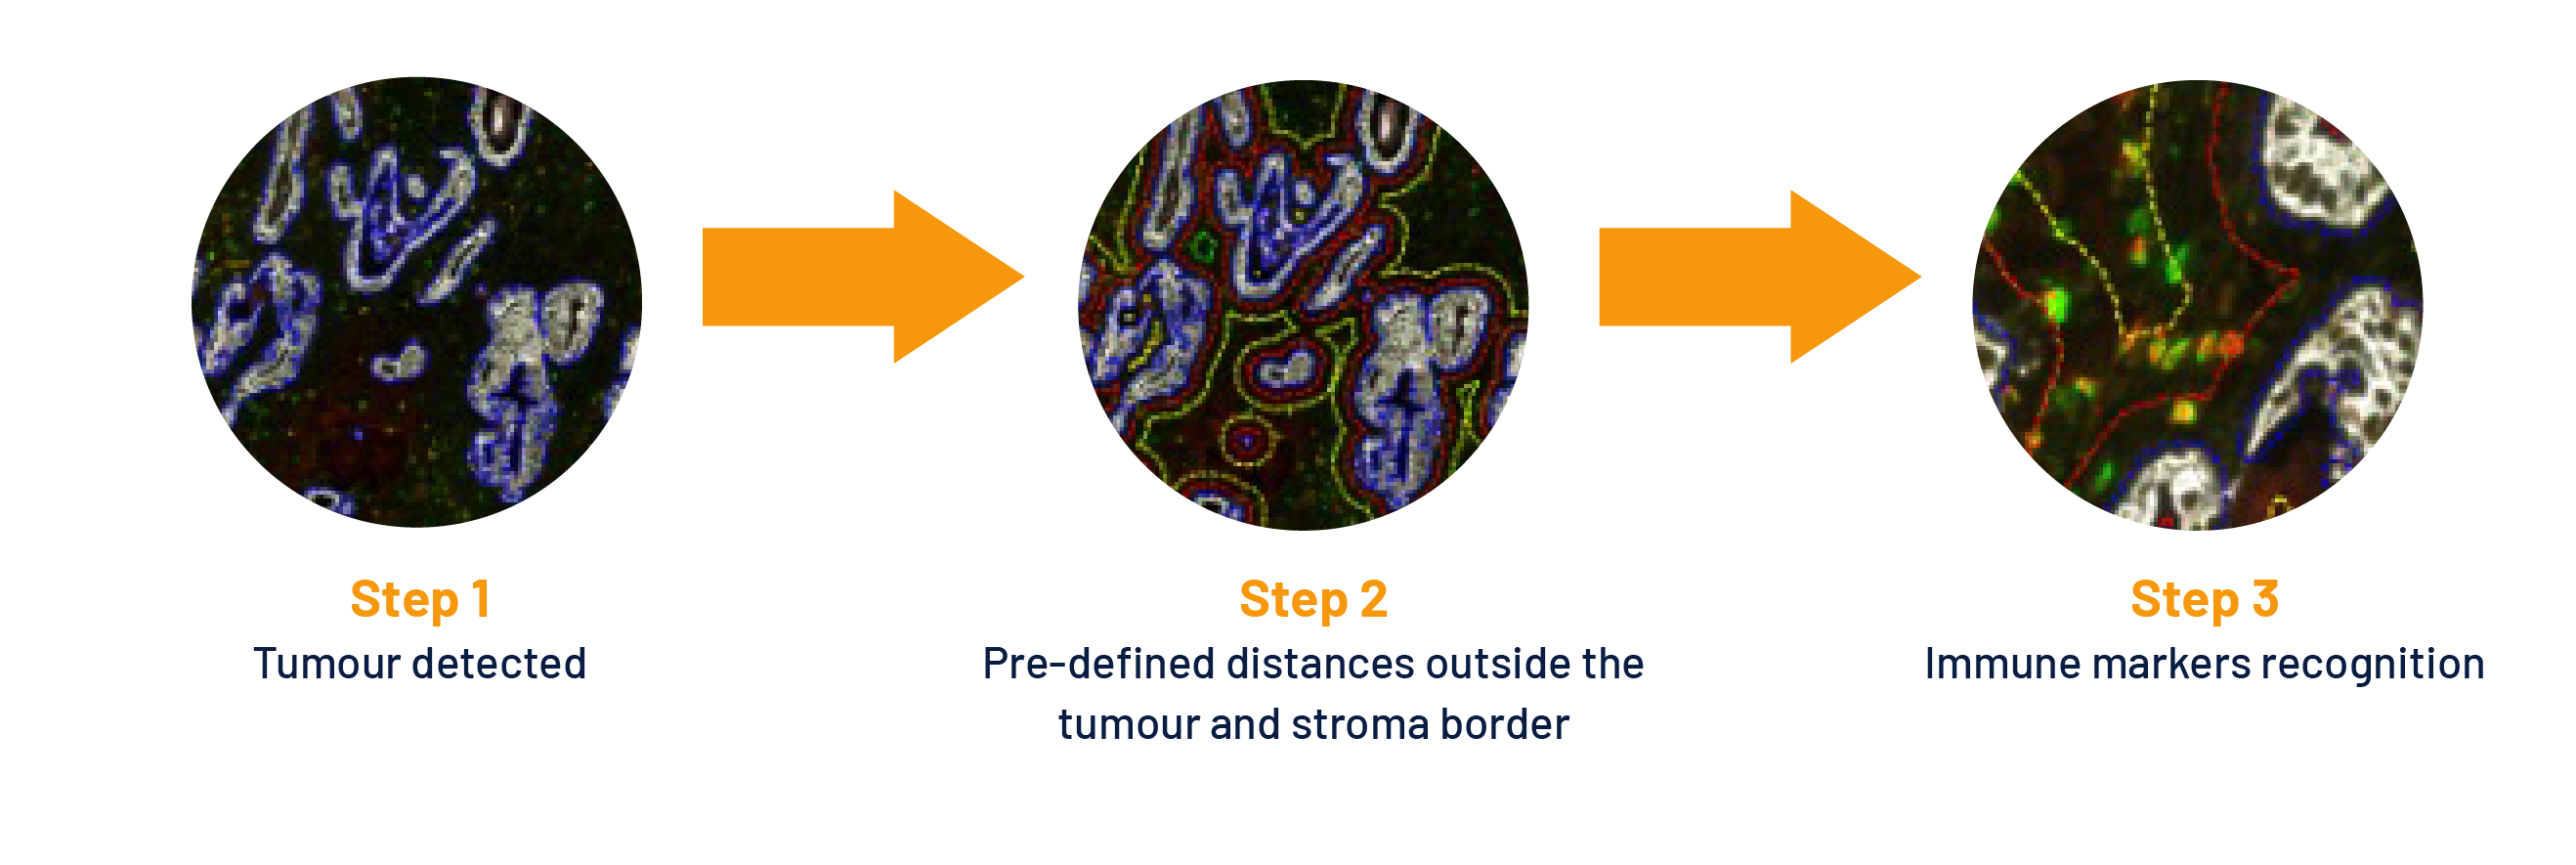
Quantification of immune cells relative to tumour and stroma boundaries:
Analysis of cell–cell interactions and distribution to understand mechanisms of action and tissue organisation:
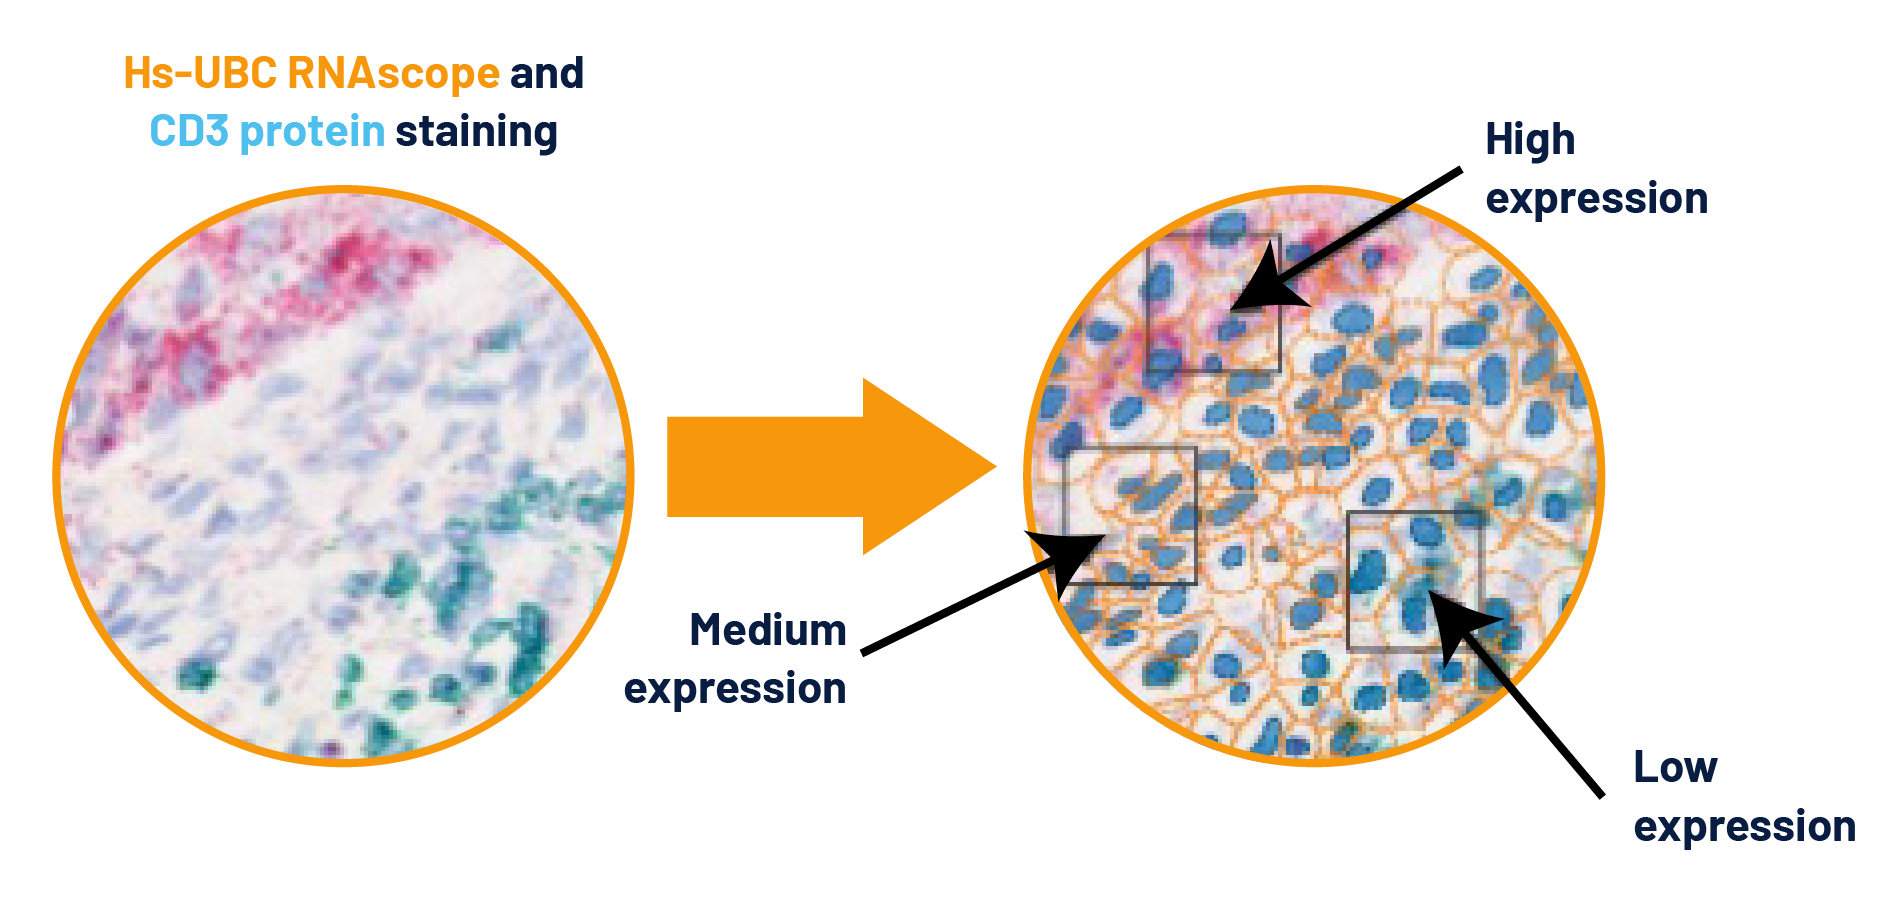
Quantitative analysis of spatial RNA expression using in situ hybridization -stained tissue:
Our IHC and ISH services integrate seamlessly with our broader spatial biology offering:

